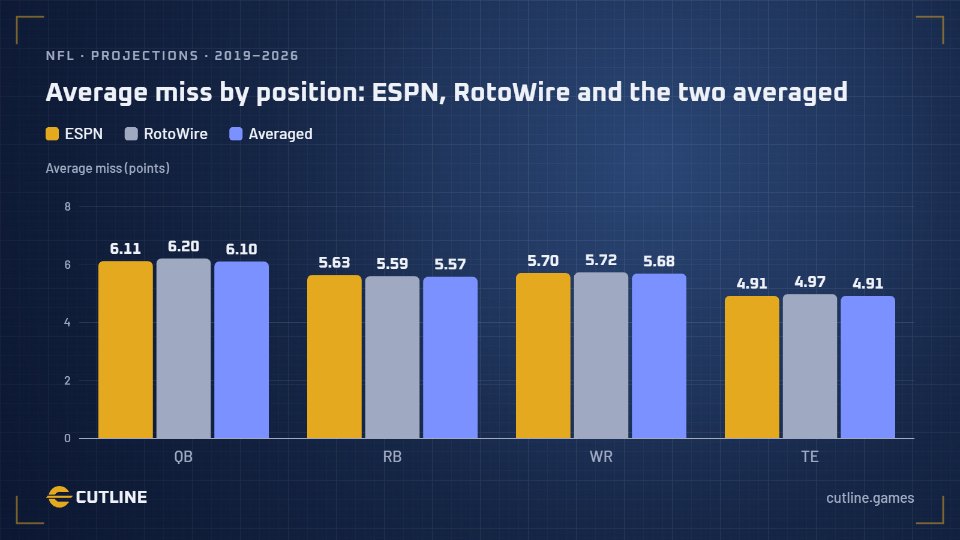
Within about 5 to 6 points a player, and better than any simple guess. Across 28,764 player-weeks since 2018, weekly projections missed by 4.9 points for tight ends, 5.6 for running backs, 5.7 for receivers and 6.2 for quarterbacks, in full PPR. About half landed within 5 points. They beat a player’s own season average at every position, in every stretch of seasons, and most of all early in the year.
Every week starts with a projection. Start-sit calls, waiver bids and daily lineups all lean on it. So I graded them: every weekly projection from ESPN and RotoWire from 2018 through Week 10 of 2026, averaged where both had one, against what each player actually scored.
Update, Nov 21, 2026: ESPN and RotoWire fantasy football projections graded since 2019: they miss by nearly the same, and when they disagree, the lower one wins 58% of the time. Follow-up: Which NFL fantasy projections are better, ESPN or RotoWire?.
How far off is a typical projection?
About a touchdown’s worth of points, give or take. For players projected 5 or more points, the average miss was:
- Projection
- Season average
| Projection | Season average | |
|---|---|---|
| QB | 6.2 | 6.7 |
| RB | 5.6 | 6.1 |
| WR | 5.7 | 6.1 |
| TE | 4.9 | 5.3 |
About half of projections landed within 5 points of the final score: 59% for tight ends, 54% for running backs, 51% for receivers and 48% for quarterbacks. Tight ends miss by the fewest points, and they also score the fewest. Quarterbacks miss by the most.
Are projections better than a player’s season average?
Yes, at every position. The simplest guess you can make is that a player will score what he’s averaged so far this season. On the same player-weeks, the projections missed by less and ranked players better:
- Projection
- Season average
| Projection | Season average | |
|---|---|---|
| QB | 55% | 52% |
| RB | 64% | 60% |
| WR | 50% | 46% |
| TE | 50% | 45% |
Of each week’s projected top 24 running backs, 64% finished in the week’s top 24, against 60% picked by season average. For receivers it was 50% to 46%, tight ends (top 12) 50% to 45% and quarterbacks (top 12) 55% to 52%. The projections were ahead on every measure, at every position, in both 2018–20 and 2021–26.
When do projections help most?
Early in the season. In Weeks 1 through 4, a season average is built on one to three games, and it shows. The projections’ edge in ranking players was biggest then, and smaller from Week 5 on as the averages filled in:
| Position | Wk 1–4 projection | Wk 1–4 average | Wk 5+ projection | Wk 5+ average |
|---|---|---|---|---|
| QB | 0.36 | 0.23 | 0.37 | 0.29 |
| RB | 0.54 | 0.39 | 0.52 | 0.45 |
| WR | 0.45 | 0.28 | 0.46 | 0.43 |
| TE | 0.34 | 0.22 | 0.37 | 0.35 |
By midseason the season average catches up some, but it never caught up: the projections still ranked players better at every position from Week 5 on.
Which projections miss the most?
The big ones miss by more points, but by less of their size. A receiver projected 5 to 10 points missed by 4.8 on average, about two-thirds of his projection. One projected 20 or more missed by 8.1, about a third. That pattern held at every position and in both stretches of seasons.
| Projected | QB | RB | WR | TE | Share, all |
|---|---|---|---|---|---|
| 5–10 points | – | 4.5 | 4.8 | 4.6 | 63% |
| 10–15 | 5.8 | 5.9 | 6.1 | 5.5 | 48% |
| 15–20 | 6.1 | 6.7 | 7.3 | 6.9 | 39% |
| 20+ | 6.7 | 7.7 | 8.1 | – | 33% |
So treat a small projection as a rough range: its miss is most of its size. A big projection misses by more points, but it’s closer for its size.
What should you do with this?
- Use projections over season averages, especially before Week 5.
- When two players are projected within a couple of points, the gap is smaller than the typical miss. Break the tie with role: targets, carries and snap share.
- Expect quarterbacks to miss by the most points (6.2 on average).
- Running backs were the easiest to rank within a week (rank correlation 0.54), then receivers (0.47), with tight ends (0.39) and quarterbacks (0.37) the hardest.
CUTLINE’s own games run on these numbers: Capline prices every player from the same projections, averaged. For defenses, the same test is in How well do ESPN and RotoWire rank NFL fantasy defenses? For players, ESPN against RotoWire is in Which NFL fantasy projections are better, ESPN or RotoWire?
How this was computed
- Projections: each week’s line from ESPN (2019 on) and RotoWire (2018 on), averaged where both had one, scored in full PPR from the projected stats. 2018 is RotoWire alone. These are the lines the sources still serve for past weeks. RotoWire’s come from Sleeper’s projection feed, which labels every line RotoWire.
- Actual: each player’s full PPR score that week. A projected player who didn’t play scored 0.
- Players: quarterbacks, running backs, receivers and tight ends projected 5 or more points: 28,764 player-weeks across 151 weeks.
- Season average: a player’s average score in his earlier games that season; compared on the player-weeks that have one (Week 2 on).
- Average miss: the average gap between projected and actual points.
- Rank correlation: within each week and position, how closely the projected order matched the actual order (1 is perfect, 0 is none), averaged over weeks.
- Top tier: of each week’s 12 highest-projected quarterbacks and tight ends or 24 running backs and receivers, the share that finished in that week’s top 12 or 24 among everyone who played.
- Stretches: 2018–20 and 2021–26 (2021 began the 17-game seasons). Each claim here holds in both.
Data: game stats from nflverse; projections from ESPN, and from RotoWire as Sleeper serves them.