Final: TB 24, CHI 27 (halftime TB 6, CHI 17)
- Held: The Bears win (71%): yes
- The sim’s average: TB 20.9, CHI 27.4
- Held: Total points (6 in 10): 51, inside 37–58
- Held: D'Andre Swift scores the first TD (20%): no
- Held: Chris Godwin Jr. scores a TD (24%): no
- Held: Chris Godwin Jr. receiving yards (6 in 10): 16, inside 16–62
- Held: Baker Mayfield passing yards (6 in 10): 243, inside 160–260
- Missed: Rome Odunze scores a TD (25%): yes
- Held: Rome Odunze receiving yards (6 in 10): 60, inside 19–67
- Held: Roschon Johnson scores a TD (25%): no
- Missed: Ted Hurst III receiving yards (6 in 10): 0, outside 7–46
- Held: Kenny Gainwell scores a TD (25%): no
- Held: Kenny Gainwell rushing yards (6 in 10): 16, inside 13–46
- Missed: Luther Burden III scores a TD (41%): yes
- Missed: Luther Burden III receiving yards (6 in 10): 97, outside 30–85
- Held: Emeka Egbuka scores a TD (28%): no
- Held: Emeka Egbuka receiving yards (6 in 10): 38, inside 24–77
- Held: Kalif Raymond scores a TD (21%): no
- Held: Kalif Raymond receiving yards (6 in 10): 32, inside 9–47
- Missed: D'Andre Swift scores a TD (67%): no
- Missed: D'Andre Swift rushing yards (6 in 10): 31, outside 58–120
- Held: Bucky Irving scores a TD (54%): yes
- Missed: Bucky Irving rushing yards (6 in 10): 97, outside 37–90
- Held: Colston Loveland scores a TD (38%): no
- Held: Colston Loveland receiving yards (6 in 10): 54, inside 28–82
- Held: Caleb Williams passing yards (6 in 10): 279, inside 202–300
- Held: Kenny Gainwell has 15+ rushing yards (77%): yes
- Held: Bucky Irving has 45+ rushing yards (71%): yes
- Held: Both of the two to watch (56%): yes
- Held: The Bears lead at halftime (61%): yes
- Held: When the Bears lead at halftime, the Bears win (88%): yes
- Missed: The Bears outscore the other side after halftime (58%): no
- Missed: D'Andre Swift has 30+ rushing yards after halftime (69%): no
The Bears win 71% of 10,000 simulations. The average score is Buccaneers 21, Bears 27, and the total lands between 37 and 58 points in 6 games of 10. Two to watch: Kenny Gainwell has 15+ rushing yards (77%) and Bucky Irving has 45+ rushing yards (71%); both happen in 56% of the simulations.
The game in 10,000 simulations
The Bears win 71% of the simulations and the Buccaneers 29%. Each team’s points vary a lot from one simulated game to the next, so the table shows the middle 6 games in 10 beside the average.
| Wins | Average points | Middle 6 in 10 | |
|---|---|---|---|
| Buccaneers | 29% | 20.9 | 13–28 |
| Bears | 71% | 27.4 | 20–34 |
| Total | – | 48.3 | 37–58 |
Two to watch
Of everything a single player can do in this game, these two outcomes each happen in at least 6 simulations of 10, and together they happen most often: Kenny Gainwell has 15+ rushing yards in 77% of the games, Bucky Irving has 45+ rushing yards in 71%, and both in 56%. As two unrelated chances they’d come up together 54% of the time; in the simulations they come up more often, because the same games produce them.
Who scores
D'Andre Swift scores in 67% of the simulations, the most of anyone. The likeliest first touchdown is D'Andre Swift’s, in 20% of the games. A touchdown is never likely for more than a handful of players: past the top few, most score in fewer than 1 game in 5.
| Touchdown chance | |
|---|---|
| D'Andre Swift (CHI) | 67% |
| Bucky Irving (TB) | 54% |
| Luther Burden III (CHI) | 41% |
| Colston Loveland (CHI) | 38% |
| Emeka Egbuka (TB) | 28% |
| Rome Odunze (CHI) | 25% |
| Kenny Gainwell (TB) | 25% |
| Roschon Johnson (CHI) | 25% |
| Chris Godwin Jr. (TB) | 24% |
| Kalif Raymond (CHI) | 21% |
Yardage ranges
The average is what a player gets across the 10,000 games; the range is where the middle 6 of 10 land. A wide range means the game script swings it: a lead, a deficit, or one long play.
| Player | Team | Yards | Average | Middle 6 in 10 |
|---|---|---|---|---|
| Caleb Williams | CHI | passing | 252 | 202–300 |
| Baker Mayfield | TB | passing | 211 | 160–260 |
| D'Andre Swift | CHI | rushing | 90 | 58–120 |
| Bucky Irving | TB | rushing | 65 | 37–90 |
| Luther Burden III | CHI | receiving | 59 | 30–85 |
| Colston Loveland | CHI | receiving | 56 | 28–82 |
| Emeka Egbuka | TB | receiving | 52 | 24–77 |
| Rome Odunze | CHI | receiving | 44 | 19–67 |
| Chris Godwin Jr. | TB | receiving | 41 | 16–62 |
| Kenny Gainwell | TB | rushing | 31 | 13–46 |
| Kalif Raymond | CHI | receiving | 29 | 9–47 |
| Ted Hurst III | TB | receiving | 27 | 7–46 |
What goes together
The simulations show which outcomes travel together. Each line is how often the second thing happens in the games where the first one does, against how often it happens overall.
- When the Bears lead at halftime, the Bears win (88%).
- When the Buccaneers lead at halftime, the Bears win anyway (39%).
- When Baker Mayfield throws 2+ TDs, the game has 49+ points (67%, against 48% overall).
- When Baker Mayfield throws 2+ TDs, the Bears win by 6+ (38%, against 53% overall).
- When Cade Otton scores a TD, the game has 49+ points (63%, against 48% overall).
2nd Half Adjustments
At halftime the Bears lead in 61% of the simulations and the Buccaneers in 31% (8% are tied). When the Bears lead at the half they go on to win 88% of the time; when the Buccaneers lead, the Bears still win 39%. After halftime the Bears outscore the other side in 58% of the games, and the second half’s points land between 16 and 31 in 6 games of 10.
D'Andre Swift has 30+ rushing yards after halftime in 69% of the simulations, the most yards any back or receiver clears that often in a second half.
This season so far, the Buccaneers have scored 10 and allowed 9.4 a game after halftime (8 games), against 12.2 and 9.5 before it; the Bears have scored 12 and allowed 9.5 a game after halftime (8 games), against 14.8 and 10.5 before it. A team’s second-half edge carries only weakly from one part of a season to the next: in 2024 and 2025, how much better a team was after halftime than before it in Weeks 1–9 told little about Weeks 10–18. So the simulation doesn’t lean on these splits; they’re context, not the call.
The news it plays with
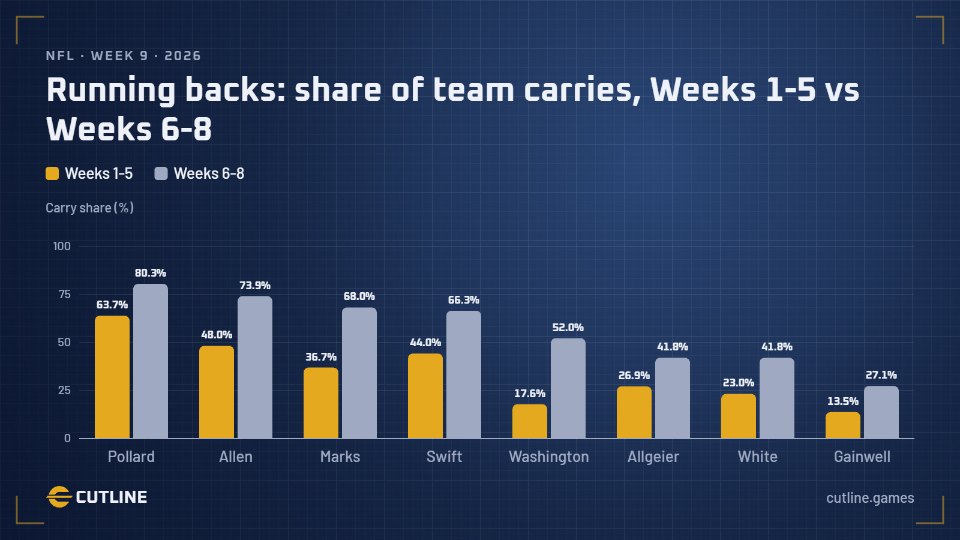
As of Sunday morning. Chicago is without running back Kyle Monangai (thumb and toe), who was listed as questionable but is expected to sit until after the bye, so the run leaves him out and D'Andre Swift carries most of the load with Roschon Johnson behind him. Zavier Scott went on injured reserve Thursday, which leaves the backfield thin. For Tampa Bay, Emeka Egbuka (foot), who hasn't had a target or a carry since Week 6, is active after full practices Thursday and Friday, and the run gives him his full share. Left tackle Tristan Wirfs (toe) plays without a designation; edge rusher Yaya Diaby (knee) is out. Last week, in the rain against Atlanta, Tampa Bay ran on almost every snap: Bucky Irving had 27 carries for 170 yards and a touchdown, Kenny Gainwell 25 for 140, and Baker Mayfield completed none of his 4 passes. The run uses each player's season-long shares, so that one game is a small part of the mix, and Tampa Bay throws far more often in it than it did last week. Chicago traded for defensive tackle Jeffery Simmons on Oct 29; he had a sack in his debut, last week's 34-17 win at Seattle.
How the simulation works
Every play comes from real plays: the offense’s own from this season and last, the plays its opponent’s defense allowed, and the league’s, picked by down, distance, field position, score and time. A pass goes to its target and a run to its ball carrier by this season’s shares, with players ruled out taken off, and the clock runs as fast as real games run it.
The simulation is tuned to the market: its chance of each margin and each total matches the prices of the game’s lines. On its own, replayed over the 2025 season, it ordered teams much like the closing lines did but never beat them, so it isn’t here to pick a side. What it adds is the shape of the game: each player’s range, and what goes together.
Every number in this article is checked after the game. What happened goes at the top.